Simulation Mode
In Simulation Mode, you can watch your network run at a slower pace, observing the paths that packets take and inspecting them in detail.
When you switch to Simulation Mode, the Simulation Panel will appear. You can graphically create PDUs to send between devices using the Add Simple PDU button and then pressing the Auto Capture / Play button to start the simulation scenario. The Event List window records (or "captures") what happens as your PDU propagates through the network. You can control the speed of the simulation by using the Play Speed Slider. Pressing the Auto Capture / Play toggle button again will pause the simulation. If you need greater control of the simulation, use Capture / Forward button to manually run the simulation forward one step in time. You can use the Back button to revisit a previous timeframe and view the events that occurred then.
| When your instance of Packet Tracer is connected to a Multiuser remote peer, you will not be able to switch to Simulation Mode. When you attempt to switch to Simulation Mode, you will be prompted to save an offline copy that is to be opened in a new instance of Packet Tracer. Clicking Yes will cause Packet Tracer to use the current offline saving settings to create an offline save and open it in a new Packet Tracer instance immediately. From there, you will be able to use Simulation Mode to examine packets in detail. |
You can clear and restart the scenario with the Reset Simulation button, which clears all entries in the Event List.
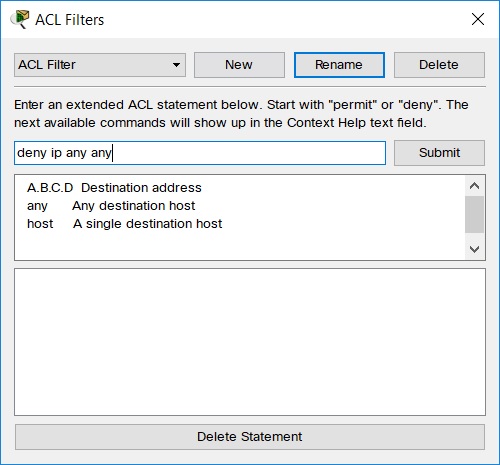
Note that while a simulation is playing, you may see packets that you did not create yourself. That is because some devices can generate their own packets (such as EIGRP packets) as the network runs. You may also see a QoS Stamp on packets as well, which is described in detail in the "QoS Stamp" section below. You can see what types of packets are being propagated in the network by looking at the Type field in the Event List. You can choose to hide these packets from view by clicking on the Edit Filters button and unchecking the appropriate filter from the menu that appears. To show all types of packets, simply click on the Show All button to re-enable them all. You can also create your own ACL Filter by clicking on the Edit ACL Filters button in the Edit Filters menu. In the ACL Filters dialog, you can create a New ACL Filter, Delete an ACL Filter, and Submit extended ACL statements to an ACL Filter.

You can also hide the Event List (and the entire Simulation Panel) with the Event List button in the Simulation Bar. You will still have access to the Play Controls on the bar.

The Event List and Time Flow of Events
Packet Tracer simulations do not run on a linear time scale. Time is determined by the events that occur. An event can be defined as any instance of a PDU that is generated in the network. The Event List keeps track of all such PDU instances and lists their information in various fields:
| You can rearrange each of these fields in the Event List by dragging the title of a field to the desired position. |
Some events occur very frequently, happening every few milliseconds. Some events occur very infrequently, happening every minute or so. On the workspace, network events appear to happen one after another at the same speed (set by the slider), when actually they may be separated by milliseconds or by minutes. You can keep track of event timing by looking at the Time field in the Event List. Time only advances when there are events to be captured. If the network has no further events, time will essentially halt (until the next event occurs). The Auto Capture Indicator will tell you where the Event List stopped recording. You can enforce a constant delay of 1 ms between events by using the Constant Delay option. If this option is off, various factors will contribute to the overall delay of the event: transmission delay, propagation delay, and a randomly injected process delay.
| If you filter out some type of PDUs on the Event List Filters, they will not show up on the Event List. They are still in the network; you just do not see them. The simulation runs more quickly because you will not see the filtered events, but all filtered PDUs still affect the network. |
Restarting a Scenario
Whenever a simulation restarts, the simulation time resets to 0.000 and the Event List is cleared. You will restart the simulation if you do any of the following:
| Restarting a simulation does not erase current or scheduled PDU processes; it simply pauses the simulation and removes the visual clutter of events currently displayed on the Event List. The only way to remove PDU processes is from the User Created Packet Window (discussed on the "Managing Simulation Scenarios" page). |
Sending Simple PDUs (Ping)
In Packet Tracer, the Add Simple PDU button is essentially a quick, graphical way to send one-shot pings. You can send pings between devices that have at least one interface with an IP address. To send a ping, click the Add Simple PDU button (the cursor changes to a "packet" icon), click on the source device, and then click on the destination device. Note that pings will only work if the devices have configured ports. After you make the request, the source device will queue an ICMP or ARP packet (or both), which will be on standby until you click the Auto Capture / Play or Capture / Forward button. When you click one of these buttons, the packets will start moving and you can observe the ping process. You may want to hide certain types of packets in the Event List Filters to avoid being confused by other packets in the network that you do not wish to observe.
You can keep track of all of the PDUs you created with the Add Simple PDU button in the User Created Packet Window. See the "Scenarios" page for more information.
QoS Stamps
QoS Stamps are visual indicators that the ToS/DiffServ (ToS = Type of Service, DiffServ = Differentiated Services) field has been set in the IP header. Usually this field is 0, but a value other than 0 will cause a color to appear. It does not indicate that it will be processed in any special way or that anything in particular will happen to it. It is just a marker that says "this field is different."
Qos Stamps are useful in that it is one way a QoS algorithm will tag packets as they pass through the interface for processing into queues on the other end. Setting the ToS/DiffServ field on the packet means that the router can check that value later when looking to put packets into certain priority queues. Marking the packets at the edge means that the core routers can treat them however they need to without guessing at the intended priority level. The reason it is referred to as a ToS/DiffServ field is that the field was originally called the TOS field which contained IP precedence bits. That was obsolete by the DiffServ field, which uses a DSCP (Differentiated Services Code Point). This is the 6 most significant bits in that field. The other two bits serve other purposes for congestion notifications. So, the proper name for those 6 bits is the "Differentiated Services Code Point," but they can also be modified by precedence or things that set the Type of Service. So, all still apply.
Packet Tracer will only display QoS Stamps in Simulation Mode and when the ToS/Diffserv field has been set. This field can be set by using the Traffic Generator utility on an end device, the ping command on an end device, extended ping on a router, or the set commands for class-maps inside a policy-map. When using the ping command or Traffic Generator, this value sets the entire ToS field in the header. The ToS/DiffServ Color Table, which is shown below, only goes up to 64 values because the two least significant bits are reserved and not used to show the colors. Because of this, it is necessary to bit-shift your value two places to the left. The easiest way to do this is to multiply your given ToS value twice. So, if you have the value 1, 1 * 2 = 2, 2 * 2 = 4. Or, for the value 5, 5 * 2 = 10, 10 * 2 = 20.
To read the ToS/DiffServ Color Table, look at the column labeled S0-D2. The values range from 0-63. When the number is 0, the color is empty (no QoS Stamp). The other colors presented there are what will show up when the ToS field takes on that value. Remember, if you use ping or the Traffic Generator utility, you have to multiply that number by two (e.g., to see the first ping color you need to multiply 8 * 2 = 16, 16 * 2 = 32. So, set the value 32 into the ToS field).
| S0 | S1 | S2 | D0 | D1 | D2 | ECT | CE | S0-D2 | Meaning | Red | Green | Blue | Color | Hex |
| 0 | 0 | 0 | 0 | 0 | 0 | 0 | 0 | 0 | Default Precedence | 255 | 255 | 255 | 0xFFFFFF | |
| 0 | 0 | 0 | 0 | 0 | 1 | 0 | 0 | 1 | Local Use | 40 | 40 | 40 | 0x282828 | |
| 0 | 0 | 0 | 0 | 1 | 0 | 0 | 0 | 2 | Local Use | 45 | 45 | 45 | 0x2D2D2D | |
| 0 | 0 | 0 | 0 | 1 | 1 | 0 | 0 | 3 | Local Use | 50 | 50 | 50 | 0x323232 | |
| 0 | 0 | 0 | 1 | 0 | 0 | 0 | 0 | 4 | Local Use | 55 | 55 | 55 | 0x373737 | |
| 0 | 0 | 0 | 1 | 0 | 1 | 0 | 0 | 5 | Local Use | 60 | 60 | 60 | 0x3C3C3C | |
| 0 | 0 | 0 | 1 | 1 | 0 | 0 | 0 | 6 | Local Use | 65 | 65 | 65 | 0x414141 | |
| 0 | 0 | 0 | 1 | 1 | 1 | 0 | 0 | 7 | Local Use | 70 | 70 | 70 | 0x464646 | |
| 0 | 0 | 1 | 0 | 0 | 0 | 0 | 0 | 8 | Priority Precedence | 255 | 0 | 255 | 0xFF00FF | |
| 0 | 0 | 1 | 0 | 0 | 1 | 0 | 0 | 9 | Local Use | 75 | 75 | 75 | 0x4B4B4B | |
| 0 | 0 | 1 | 0 | 1 | 0 | 0 | 0 | 10 | AF11 (Class 1 - Low Drop) | 255 | 200 | 200 | 0xFFC8C8 | |
| 0 | 0 | 1 | 0 | 1 | 1 | 0 | 0 | 11 | Local Use | 80 | 80 | 80 | 0x505050 | |
| 0 | 0 | 1 | 1 | 0 | 0 | 0 | 0 | 12 | AF12 (Class 1 - Med Drop) | 255 | 110 | 110 | 0xFF6E6E | |
| 0 | 0 | 1 | 1 | 0 | 1 | 0 | 0 | 13 | Local Use | 85 | 85 | 85 | 0x555555 | |
| 0 | 0 | 1 | 1 | 1 | 0 | 0 | 0 | 14 | AF13 (Class 1 - High Drop) | 255 | 0 | 0 | 0xFF0000 | |
| 0 | 0 | 1 | 1 | 1 | 1 | 0 | 0 | 15 | Local Use | 90 | 90 | 90 | 0x5A5A5A | |
| 0 | 1 | 0 | 0 | 0 | 0 | 0 | 0 | 16 | Immediate Precedence | 128 | 255 | 255 | 0x80FFFF | |
| 0 | 1 | 0 | 0 | 0 | 1 | 0 | 0 | 17 | Local Use | 95 | 95 | 95 | 0x5F5F5F | |
| 0 | 1 | 0 | 0 | 1 | 0 | 0 | 0 | 18 | AF21 (Class 2 - Low Drop) | 200 | 255 | 200 | 0xC8FFC8 | |
| 0 | 1 | 0 | 0 | 1 | 1 | 0 | 0 | 19 | Local Use | 100 | 100 | 100 | 0x646464 | |
| 0 | 1 | 0 | 1 | 0 | 0 | 0 | 0 | 20 | AF22 (Class 2 - Med Drop) | 150 | 255 | 150 | 0x96FF96 | |
| 0 | 1 | 0 | 1 | 0 | 1 | 0 | 0 | 21 | Local Use | 105 | 105 | 105 | 0x696969 | |
| 0 | 1 | 0 | 1 | 1 | 0 | 0 | 0 | 22 | AF23 (Class 2 - High Drop) | 0 | 255 | 0 | 0x00FF00 | |
| 0 | 1 | 0 | 1 | 1 | 1 | 0 | 0 | 23 | Local Use | 110 | 110 | 110 | 0x6E6E6E | |
| 0 | 1 | 1 | 0 | 0 | 0 | 0 | 0 | 24 | Flash Precedence | 128 | 0 | 0 | 0x800000 | |
| 0 | 1 | 1 | 0 | 0 | 1 | 0 | 0 | 25 | Local Use | 115 | 115 | 115 | 0x737373 | |
| 0 | 1 | 1 | 0 | 1 | 0 | 0 | 0 | 26 | AF31 (Class 3 - Low Drop) | 190 | 190 | 255 | 0xBEBEFF | |
| 0 | 1 | 1 | 0 | 1 | 1 | 0 | 0 | 27 | Local Use | 120 | 120 | 120 | 0x787878 | |
| 0 | 1 | 1 | 1 | 0 | 0 | 0 | 0 | 28 | AF32 (Class 3 - Med Drop) | 110 | 110 | 255 | 0x6E6EFF | |
| 0 | 1 | 1 | 1 | 0 | 1 | 0 | 0 | 29 | Local Use | 125 | 125 | 125 | 0x7D7D7D | |
| 0 | 1 | 1 | 1 | 1 | 0 | 0 | 0 | 30 | AF33 (Class 3 - High Drop) | 0 | 0 | 255 | 0x0000FF | |
| 0 | 1 | 1 | 1 | 1 | 1 | 0 | 0 | 31 | Local Use | 130 | 130 | 130 | 0x828282 | |
| 1 | 0 | 0 | 0 | 0 | 0 | 0 | 0 | 32 | Flash Override Precedence | 0 | 128 | 0 | 0x008000 | |
| 1 | 0 | 0 | 0 | 0 | 1 | 0 | 0 | 33 | Local Use | 135 | 135 | 135 | 0x878787 | |
| 1 | 0 | 0 | 0 | 1 | 0 | 0 | 0 | 34 | AF41 (Class 4 - Low Drop) | 255 | 255 | 200 | 0xFFFFC8 | |
| 1 | 0 | 0 | 0 | 1 | 1 | 0 | 0 | 35 | Local Use | 140 | 140 | 140 | 0x8C8C8C | |
| 1 | 0 | 0 | 1 | 0 | 0 | 0 | 0 | 36 | AF42 (Class 4 - Med Drop) | 255 | 255 | 150 | 0xFFFF96 | |
| 1 | 0 | 0 | 1 | 0 | 1 | 0 | 0 | 37 | Local Use | 145 | 145 | 145 | 0x919191 | |
| 1 | 0 | 0 | 1 | 1 | 0 | 0 | 0 | 38 | AF43 (Class 4 - High Drop) | 255 | 255 | 0 | 0xFFFF00 | |
| 1 | 0 | 0 | 1 | 1 | 1 | 0 | 0 | 39 | Local Use | 150 | 150 | 150 | 0x969696 | |
| 1 | 0 | 1 | 0 | 0 | 0 | 0 | 0 | 40 | CRITIC/ECP Precedence | 0 | 0 | 128 | 0x000080 | |
| 1 | 0 | 1 | 0 | 0 | 1 | 0 | 0 | 41 | Local Use | 155 | 155 | 155 | 0x9B9B9B | |
| 1 | 0 | 1 | 0 | 1 | 0 | 0 | 0 | 42 | Local Use | 160 | 160 | 160 | 0xA0A0A0 | |
| 1 | 0 | 1 | 0 | 1 | 1 | 0 | 0 | 43 | Local Use | 165 | 165 | 165 | 0xA5A5A5 | |
| 1 | 0 | 1 | 1 | 0 | 0 | 0 | 0 | 44 | Local Use | 170 | 170 | 170 | 0xAAAAAA | |
| 1 | 0 | 1 | 1 | 0 | 1 | 0 | 0 | 45 | Local Use | 175 | 175 | 175 | 0xAFAFAF | |
| 1 | 0 | 1 | 1 | 1 | 0 | 0 | 0 | 46 | Expedited Forwarding | 128 | 0 | 128 | 0x800080 | |
| 1 | 0 | 1 | 1 | 1 | 1 | 0 | 0 | 47 | Local Use | 180 | 180 | 180 | 0xB4B4B4 | |
| 1 | 1 | 0 | 0 | 0 | 0 | 0 | 0 | 48 | Internetwork Control Precedence | 128 | 128 | 0 | 0x808000 | |
| 1 | 1 | 0 | 0 | 0 | 1 | 0 | 0 | 49 | Local Use | 185 | 185 | 185 | 0xB9B9B9 | |
| 1 | 1 | 0 | 0 | 1 | 0 | 0 | 0 | 50 | Local Use | 185 | 185 | 185 | 0xB9B9B9 | |
| 1 | 1 | 0 | 0 | 1 | 1 | 0 | 0 | 51 | Local Use | 190 | 190 | 190 | 0xBEBEBE | |
| 1 | 1 | 0 | 1 | 0 | 0 | 0 | 0 | 52 | Local Use | 195 | 195 | 195 | 0xC3C3C3 | |
| 1 | 1 | 0 | 1 | 0 | 1 | 0 | 0 | 53 | Local Use | 200 | 200 | 200 | 0xC8C8C8 | |
| 1 | 1 | 0 | 1 | 1 | 0 | 0 | 0 | 54 | Local Use | 205 | 205 | 205 | 0xCDCDCD | |
| 1 | 1 | 0 | 1 | 1 | 1 | 0 | 0 | 55 | Local Use | 210 | 210 | 210 | 0xD2D2D2 | |
| 1 | 1 | 1 | 0 | 0 | 0 | 0 | 0 | 56 | Network Control Precedence | 0 | 128 | 128 | 0x008080 | |
| 1 | 1 | 1 | 0 | 0 | 1 | 0 | 0 | 57 | Local Use | 215 | 215 | 215 | 0xD7D7D7 | |
| 1 | 1 | 1 | 0 | 1 | 0 | 0 | 0 | 58 | Local Use | 220 | 220 | 220 | 0xDCDCDC | |
| 1 | 1 | 1 | 0 | 1 | 1 | 0 | 0 | 59 | Local Use | 225 | 225 | 225 | 0xE1E1E1 | |
| 1 | 1 | 1 | 1 | 0 | 0 | 0 | 0 | 60 | Local Use | 230 | 230 | 230 | 0xE6E6E6 | |
| 1 | 1 | 1 | 1 | 0 | 1 | 0 | 0 | 61 | Local Use | 235 | 235 | 235 | 0xEBEBEB | |
| 1 | 1 | 1 | 1 | 1 | 0 | 0 | 0 | 62 | Local Use | 240 | 240 | 240 | 0xF0F0F0 | |
| 1 | 1 | 1 | 1 | 1 | 1 | 0 | 0 | 63 | Local Use | 245 | 245 | 245 | 0xF5F5F5 | |
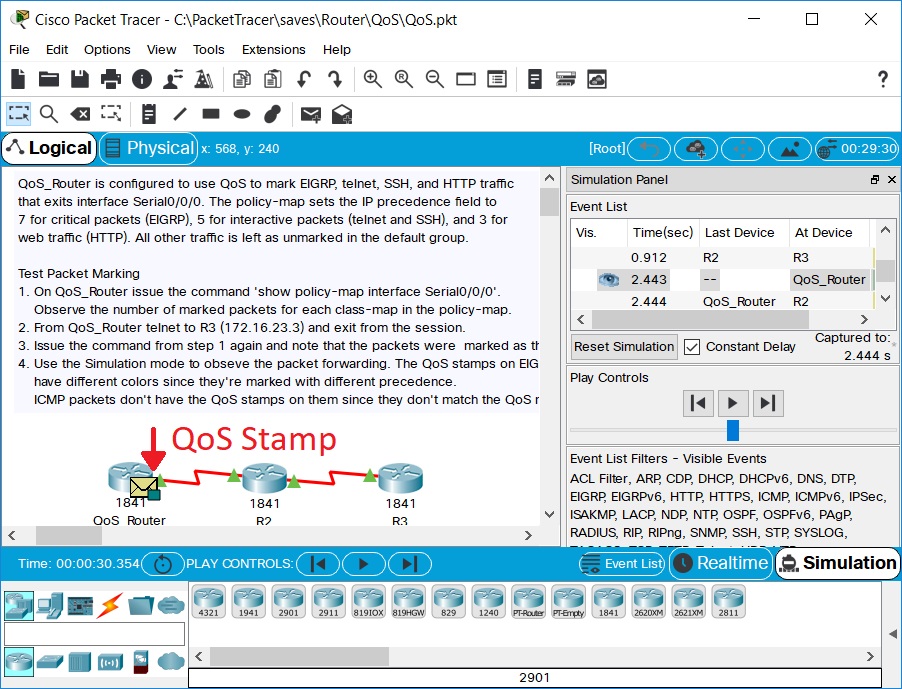
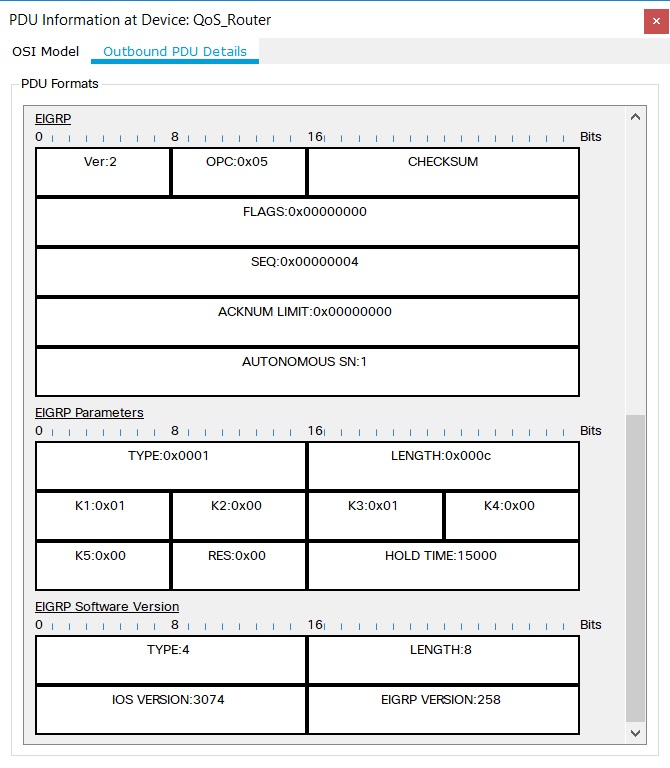
To find out what type of QoS Stamp is shown in Simulation Mode, look at the second screenshot above as an example. You can see that there is a QoS Stamp on the EIGRP packet that is at QoS_Router. Click on the EIGRP packet where the QoS Stamp appears to open the EIGRP packet's PDU information. Next, click on the Outbound PDU Details tab to reveal the headers in the EIGRP packet (refer to the "PDU Information" page for more details). The field that determines the QoS Stamp's type is the DSCP field. In this EIGRP packet, the DSCP value is 0xe0, which is a hexadecimal value. This hexadecimal value needs to be converted into decimal, which is 224. However, 224 is not in S0-D2 column in the ToS/DiffServ color table. This is because the value has been bit-shifted two places to the left. As a result, it is necessary to unshift the value in order to use the ToS/DiffServ Color Table. To do this, take the DSCP value and divide it twice. In this example, since the value is 224, 224 / 2 = 112, 112 / 2 = 56. For the value of 56, the S0-D2 column in the ToS/DiffServ Color Table indicates that this QoS Stamp is a Network Control Precedence type.

| By default, Packet Tracer shows QoS Stamps in Simulation Mode. To prevent QoS Stamps from appearing, go to Preferences and uncheck Show QoS Stamps on Packets. |